Introduction
From PhotoVoltaic Logger new generation
Overview
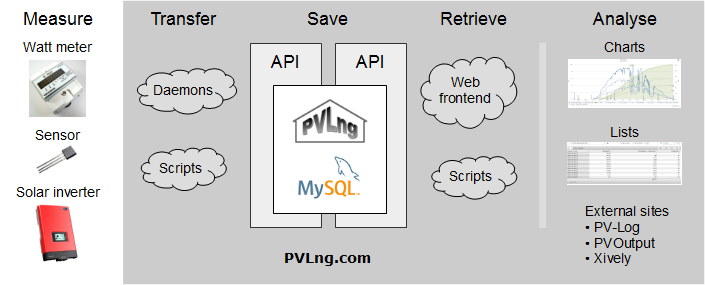
PVLng is a logging and data warehouse system for measuring data of sensors and photovoltaic plants.
The system acts basely as a data warehouse.
All data will be stored in an very simple and efficient internal structure (readings), optimized for data readout of any kind with a well defined interface.
This system addresses all the user interested in data analysis, which will have a deeper look into their logged data.
The system will accept data from any external sources and can deliver them for any purpose. A web frontend for graphing data is also integrated.
To use this system best, a deeper knowledge in server administration, shell scripting and probably PHP is recommended, but not required.
The system is build using a channel logic.
Each channel will be handled internally by a specific model.
Depending of the installed base of our solar plant, the following components are still implemented:
Data storage
- Inverter data (feed-in power, DC power voltage, Current etc.) from a SMA Webbox
- Irradiation and module temperature from a SMA Sensorbox
- Outside and inverter temperatures via USB -> 1‑Wire -> Temperature sensor
- Power consumption from watt meter via S0 impulses
Data readout
- Model for the PV-Log URL interface in JSON
- Script to push data to PVOutput
- Script to update a Twitter account
- [planned] Extractor witch creates Solar-Log compatible JS files, for example for Solar-Log homemade or SolarAnalyzer
Quick start
To get a 1st impression of the system, 2 fake channels are installed by default.
They deliver random data on each request.
To get a feeling with charts, you can use them to play around with the presentation settings.
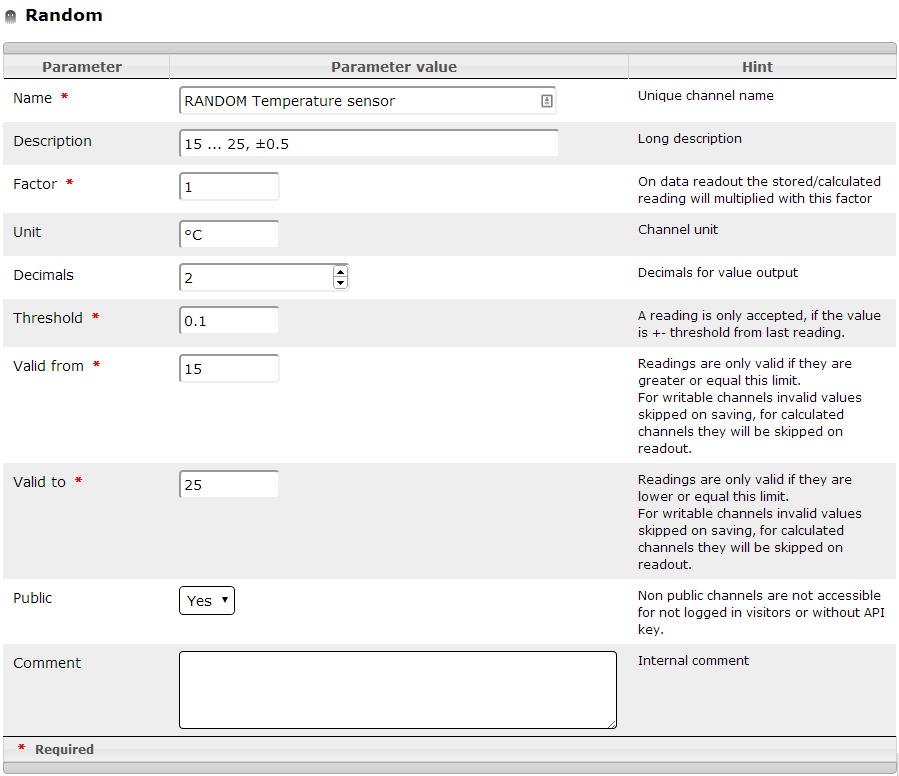
RANDOM Temperature sensor
This sensor simulates a temperature sensor in °C with a valid range of 15 ... 25 °C.
Each "next" reading differs max. ± 0.5 °C from last one.
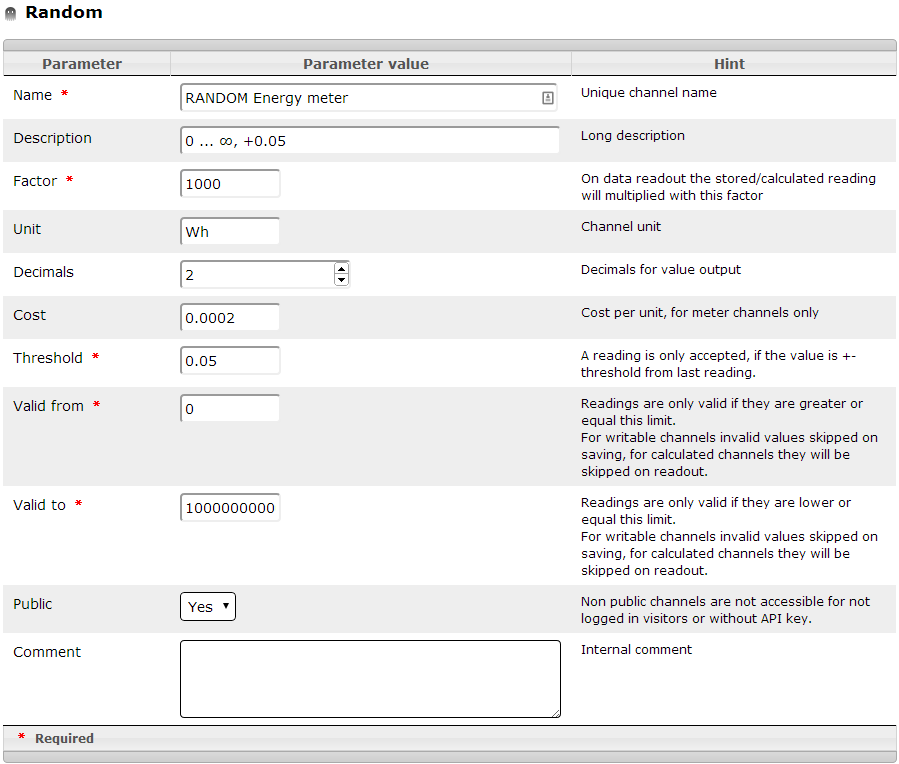
RANDOM Energy meter
This sensor simulates a energy meter with kilo watt hours readings, starting by 0 with (nearly :-) open end.
Each "next" reading differs max. + 0.2 kilo watt hour from last one.
The consumption cost 0.20 per kilo watt hour, because of the unit watt hours is it set to 0.0002
Please note: The readings here are in kilo watt hours, to get watt hours out, the resolution is set to 1000.


