Difference between revisions of "Top 10 analysis"
From PhotoVoltaic Logger new generation
(Created page with "Category:HowTo Category:Example Top 10 analysis is possible with the List module. == Example: Find the days with the most solar production == Go to your List ...") |
m |
||
| Line 11: | Line 11: | ||
* '''Select''' your channel and | * '''Select''' your channel and | ||
* Sort the '''Production / Consumption''' column '''descending''' | * Sort the '''Production / Consumption''' column '''descending''' | ||
| + | |||
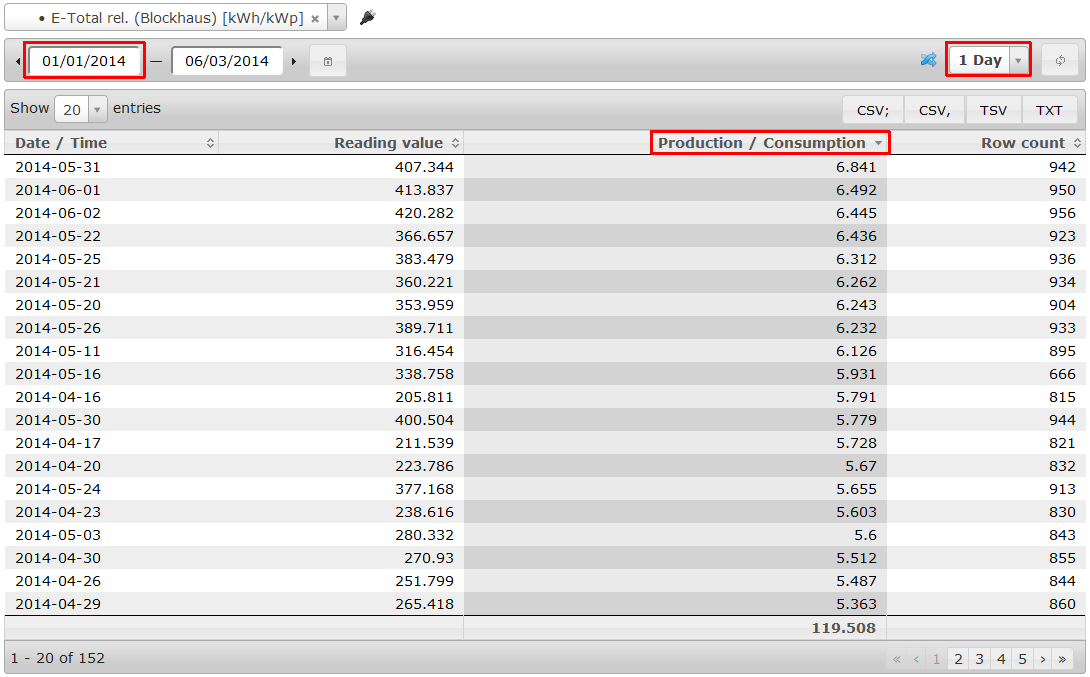
[[File:Top10Production.png]] | [[File:Top10Production.png]] | ||
Revision as of 08:31, 3 June 2014
Top 10 analysis is possible with the List module.
Example: Find the days with the most solar production
Go to your List module and make the following settings:
- Set the start date to 0 or empty the field to analyse all data or set to 1st of January for this year
- Set the consolidation period to 1 Day
- Select your channel and
- Sort the Production / Consumption column descending
