Difference between revisions of "List module"
From PhotoVoltaic Logger new generation
m (→Export) |
m |
||
| Line 1: | Line 1: | ||
| − | == | + | == Data table == |
In list module you can view your measuring data, either raw or with the same date ranges and consolidation periods as in the [[charts module]]. | In list module you can view your measuring data, either raw or with the same date ranges and consolidation periods as in the [[charts module]]. | ||
| Line 5: | Line 5: | ||
[[File:LstModuleSelect.png]] | [[File:LstModuleSelect.png]] | ||
| − | + | == Raw data == | |
| − | |||
| − | |||
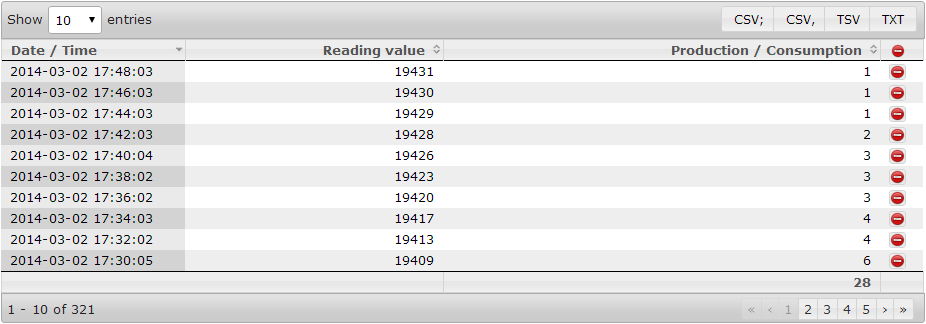
In raw data view, you can delete single readings, if there are incorrect once. | In raw data view, you can delete single readings, if there are incorrect once. | ||
| Line 13: | Line 11: | ||
[[File:ListDatatable1.png]] | [[File:ListDatatable1.png]] | ||
| − | + | == Consolidated meter channels == | |
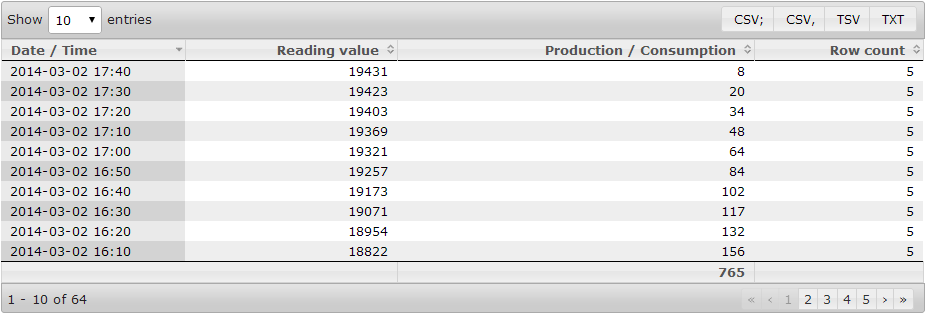
For consolidated meter channels the consumption/production during consolidation is shown. | For consolidated meter channels the consumption/production during consolidation is shown. | ||
| Line 19: | Line 17: | ||
[[File:ListDatatable2.png]] | [[File:ListDatatable2.png]] | ||
| − | + | == Consolidated sensor channels == | |
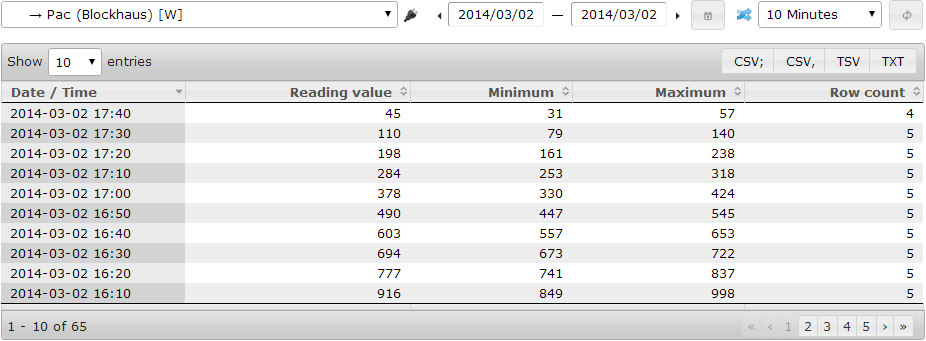
For consolidated sensor channels the min. and max. values during consolidation are shown. | For consolidated sensor channels the min. and max. values during consolidation are shown. | ||
| Line 25: | Line 23: | ||
[[File:ListDatatable3.png]] | [[File:ListDatatable3.png]] | ||
| − | + | == Export == | |
You can download the shown data in the following formats: | You can download the shown data in the following formats: | ||
Revision as of 18:50, 2 March 2014
Contents
Data table
In list module you can view your measuring data, either raw or with the same date ranges and consolidation periods as in the charts module.
Raw data
In raw data view, you can delete single readings, if there are incorrect once.
Consolidated meter channels
For consolidated meter channels the consumption/production during consolidation is shown.
Consolidated sensor channels
For consolidated sensor channels the min. and max. values during consolidation are shown.
Export
You can download the shown data in the following formats:
- CSV; - Semicolon separated data
- CSV, - Comma separated data
- TSV - TAB separated data
- TXT - Space separated data


