Difference between revisions of "Quick start"
From PhotoVoltaic Logger new generation
m (→RANDOM Temperature sensor) |
m (→RANDOM Energy meter) |
||
| Line 29: | Line 29: | ||
[[File:RandomMeter2.png]] | [[File:RandomMeter2.png]] | ||
| + | |||
| + | == Chart == | ||
| + | |||
| + | Simple chart with these 2 channels, but with | ||
| + | * Show temperature in blue, except above 20°C in red | ||
| + | |||
| + | [[File:RandomChart.png]] | ||
[[Category:Example]] | [[Category:Example]] | ||
Revision as of 22:09, 30 August 2014
To get a 1st impression of the system, 2 fake channels are installed by default.
They deliver random data on each request.
To get a feeling with charts, you can use them to play around with the presentation settings.
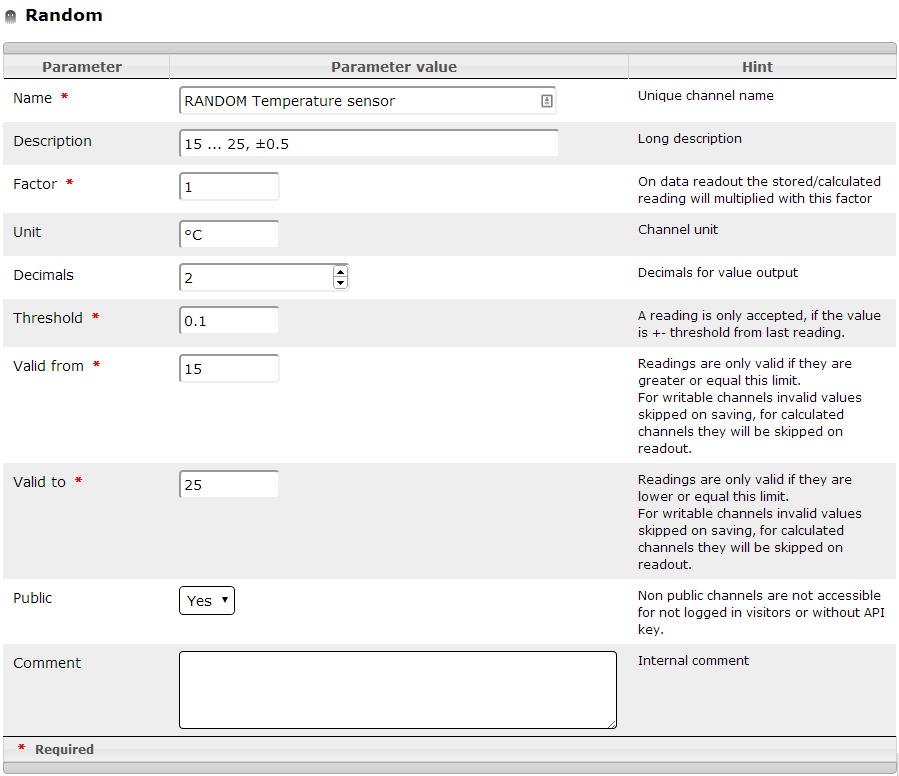
RANDOM Temperature sensor
This sensor simulates a temperature sensor in °C with a valid range of 15 ... 25 °C.
Each "next" reading differs max. ± 0.5 °C from last one.
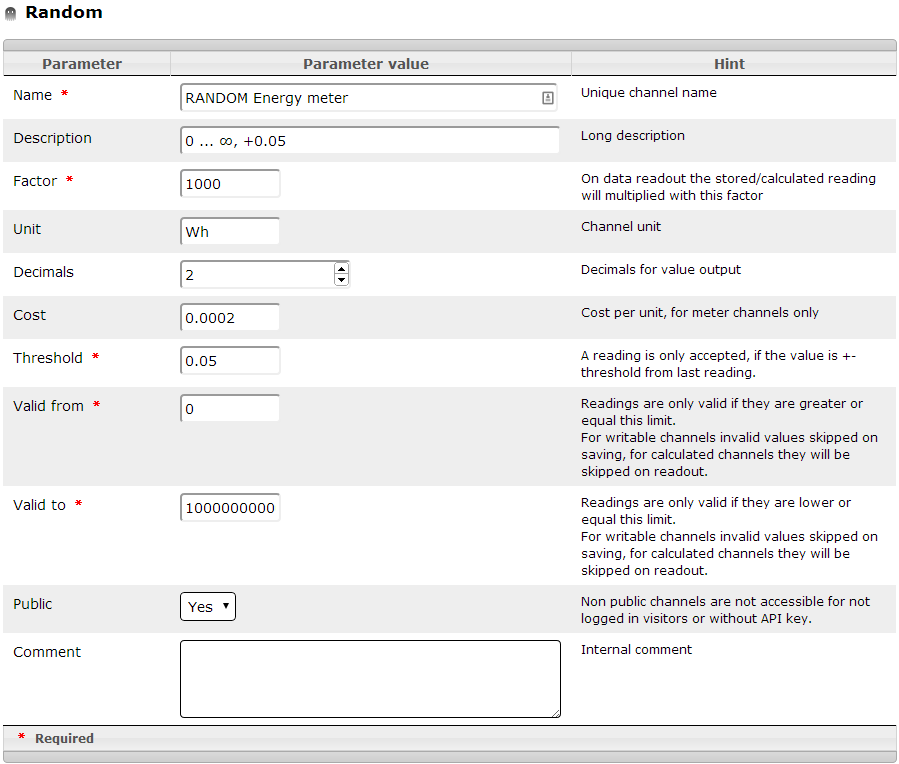
RANDOM Energy meter
This sensor simulates a energy meter with kilo watt hours readings, starting by 0 with (nearly :-) open end.
Each "next" reading differs max. + 0.2 kilo watt hour from last one.
The consumption cost 0.20 per kilo watt hour, because of the unit watt hours is it set to 0.0002
Please note: The readings here are in kilo watt hours, to get watt hours out, the resolution is set to 1000.
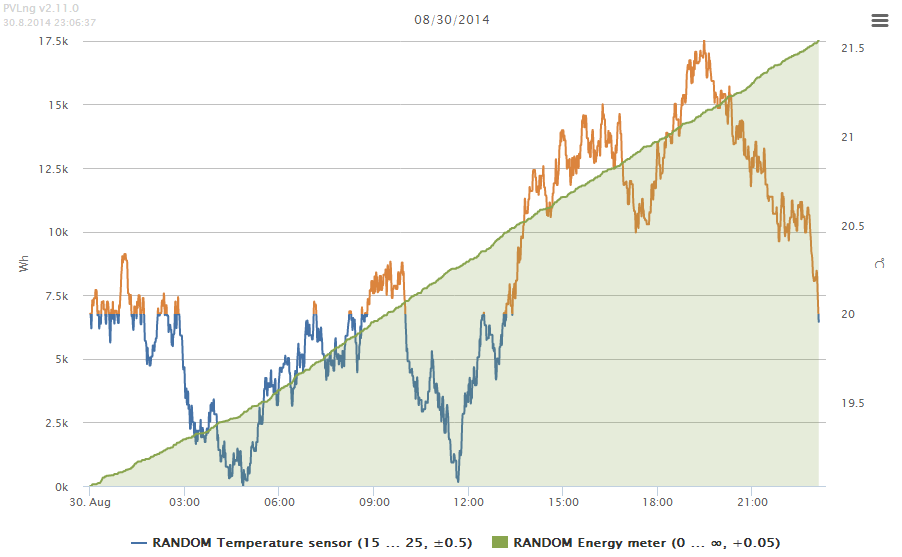
Chart
Simple chart with these 2 channels, but with
- Show temperature in blue, except above 20°C in red


