Difference between revisions of "Energy import example"
From PhotoVoltaic Logger new generation
m (→Definition) |
m (→Definition) |
||
| Line 28: | Line 28: | ||
All calculation is based on these real channels | All calculation is based on these real channels | ||
| − | * | + | * P<sub>AC</sub> [W] inverter power |
* E-Total [Wh] inverter production | * E-Total [Wh] inverter production | ||
* Power usage [W] from S0 impulses | * Power usage [W] from S0 impulses | ||
| Line 35: | Line 35: | ||
=== Power balance === | === Power balance === | ||
| − | |||
[[File:PowerBalanceTree.png]] | [[File:PowerBalanceTree.png]] | ||
This is a [[DifferentiatorFull|full differentiator]] channel to get also negative values. | This is a [[DifferentiatorFull|full differentiator]] channel to get also negative values. | ||
| − | |||
| − | |||
[[File:PowerBalanceChart.png]] | [[File:PowerBalanceChart.png]] | ||
| Line 48: | Line 45: | ||
=== Energy Import === | === Energy Import === | ||
| − | |||
For this channel we need a [[SensorToMeter]] channel, which transforms our power usage into an energy usage. ([[Channel attributes#Factor|Factor]] is here set to 1000 to get kilo watt hours from watts.) | For this channel we need a [[SensorToMeter]] channel, which transforms our power usage into an energy usage. ([[Channel attributes#Factor|Factor]] is here set to 1000 to get kilo watt hours from watts.) | ||
| Line 59: | Line 55: | ||
We define here a negative [[Channel attributes#Cost|cost]] per kilo watt hours to see later the amount consumed. (We pay here 23.44 cent per kilo watt hour == 0.2344 €) | We define here a negative [[Channel attributes#Cost|cost]] per kilo watt hours to see later the amount consumed. (We pay here 23.44 cent per kilo watt hour == 0.2344 €) | ||
| − | |||
| − | |||
[[File:EnergyImportChartSettings.png]] | [[File:EnergyImportChartSettings.png]] | ||
| + | === Internal consumption === | ||
| + | Internal consumption is simply the difference between overall energy usage and energy import. | ||
| + | [[File:InternalConsumptionTree.png]] | ||
| − | + | We get here 16.74 cent per internally used kilo watt hour == 0.1674 € | |
| − | |||
| − | |||
| − | |||
| − | |||
| − | |||
| − | |||
| − | |||
| − | |||
| − | |||
| − | |||
| − | |||
| − | |||
| − | |||
| − | |||
| − | |||
| − | |||
| − | |||
| − | |||
| − | |||
| − | |||
| − | |||
| − | |||
| − | |||
| − | |||
| − | |||
| − | |||
| − | |||
| − | |||
| − | |||
| − | |||
| − | |||
| − | + | === Energy export === | |
| − | + | [[File:EnergyExportTree.png]] | |
== Result == | == Result == | ||
Revision as of 18:14, 1 March 2014
Contents
Abstract
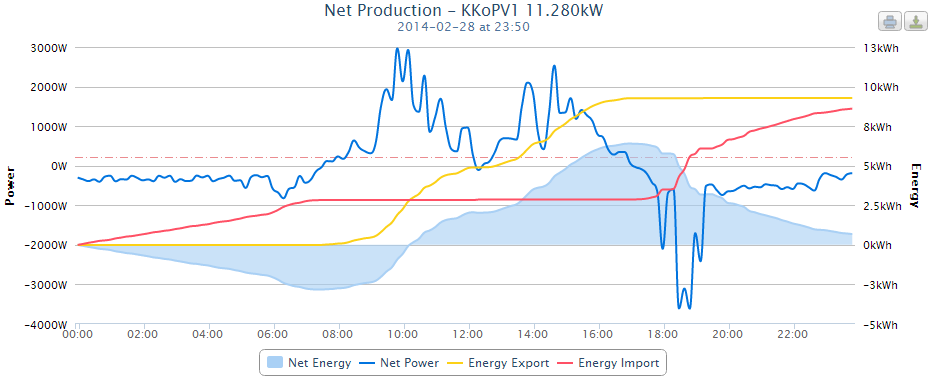
The so called "Energy import" is inspired by PVOutput energy import chart.
If the generated power (Net power) is greater than the consumption, the energy import is no more raising.
Charts
PVOutput
PVLng adoption
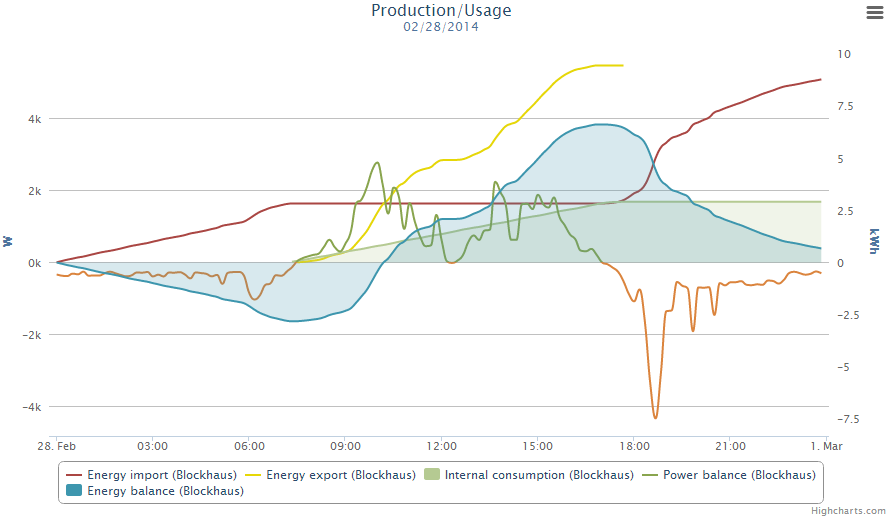
The interesting part is the red Energy import spline, which stops at 7:20 by 2820 Wh. This means, no energy import, only export. Import restarts at 17:50.
Please note:
- Arrange the channels according their units to the axes!
Definition
Let's start with the meter channels for the areas.
I decided to put all watt channels on the left and all kilo watt hour channels on the right axis.
All calculation is based on these real channels
- PAC [W] inverter power
- E-Total [Wh] inverter production
- Power usage [W] from S0 impulses
Lets prepare the calculated channels.
Power balance
This is a full differentiator channel to get also negative values.
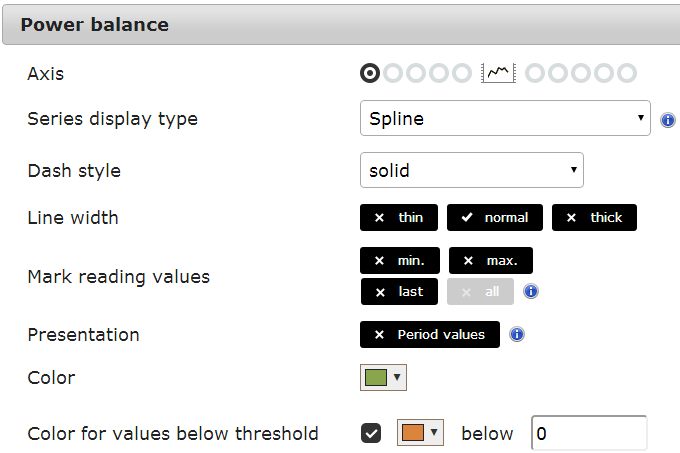
For good-bad look the negative values will be shown in red.
Energy Import
For this channel we need a SensorToMeter channel, which transforms our power usage into an energy usage. (Factor is here set to 1000 to get kilo watt hours from watts.)
The energy import channel is based on the Import / Export channel type.
We define here a negative cost per kilo watt hours to see later the amount consumed. (We pay here 23.44 cent per kilo watt hour == 0.2344 €)
File:EnergyImportChartSettings.png
Internal consumption
Internal consumption is simply the difference between overall energy usage and energy import.
We get here 16.74 cent per internally used kilo watt hour == 0.1674 €
Energy export
Result
Now we can put this all together:
In the Charts view we will have this:


