Difference between revisions of "Dashboard module"
From PhotoVoltaic Logger new generation
m |
m (→Channel definition) |
||
| Line 22: | Line 22: | ||
start > end : color | start > end : color | ||
| + | * Spaces around delimiters are optional | ||
* For <tt>start</tt> and <tt>end</tt> absolute or relative (with % suffix) values allowed, also mixed | * For <tt>start</tt> and <tt>end</tt> absolute or relative (with % suffix) values allowed, also mixed | ||
* If <tt>start</tt> is not given, begins from axis starts | * If <tt>start</tt> is not given, begins from axis starts | ||
| Line 27: | Line 28: | ||
* Colors can be defined as HTML color names (<tt>green</tt>, <tt>red</tt> etc.) or HTML color codes (<tt>#123456</tt>) | * Colors can be defined as HTML color names (<tt>green</tt>, <tt>red</tt> etc.) or HTML color codes (<tt>#123456</tt>) | ||
| − | E.g. for a temperature channel (with axis range -30°C ... 30°C) the following are equivalent | + | E.g. for a temperature channel (with axis range -30°C ... 30°C) the following are equivalent: |
> 0 : blue == -30 > 50% : #0000FF | > 0 : blue == -30 > 50% : #0000FF | ||
Revision as of 14:26, 3 March 2014
Preparation
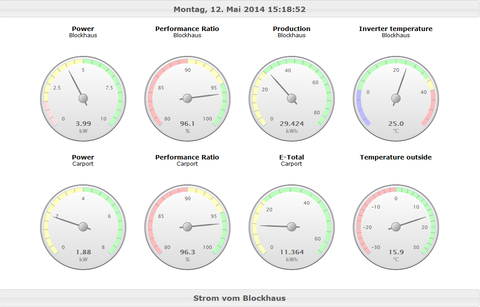
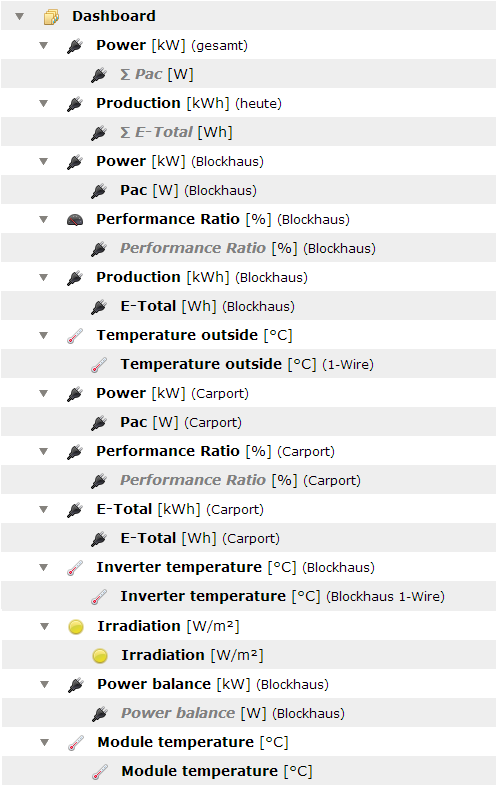
Define your dashboard using Dashboard channels.
You could also direct use "real" channels, but specialized dashboard channels have some advantages:
- Definition of axis start and end values, no auto detection
- Definable color bands on the axis
Channel definition
Define to color bands for the gauges like this.
start > end : color
- Spaces around delimiters are optional
- For start and end absolute or relative (with % suffix) values allowed, also mixed
- If start is not given, begins from axis starts
- If end is not given, ends on axis end
- Colors can be defined as HTML color names (green, red etc.) or HTML color codes (#123456)
E.g. for a temperature channel (with axis range -30°C ... 30°C) the following are equivalent:
   >  0 : blue         ==       -30 > 50%  : #0000FF
0  > 20 : green        ==       50% > 20   : #008000
20 >    : red          ==       20  > 100% : #FF0000
Example
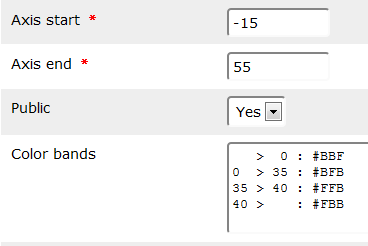
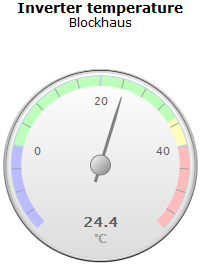
Axis range: -15°C ... 55°C
   >  0 : #FBB  // below zero
 0 > 35 : #BFB  // ok 0 ... 35°C
35 > 40 : #FFB  // warning 35°C ... 40°C
40 >    : #FBB  // critical above 40°C
Advanced usage
You can embed the dashboard also anywhere else, for example via iframe.
For this view, no authorization is required!
To get the embedded view, just use
http://your.domain.here/dashboard/embed
You can this also use to run PVLng on an info frame, just open this in full screen!


