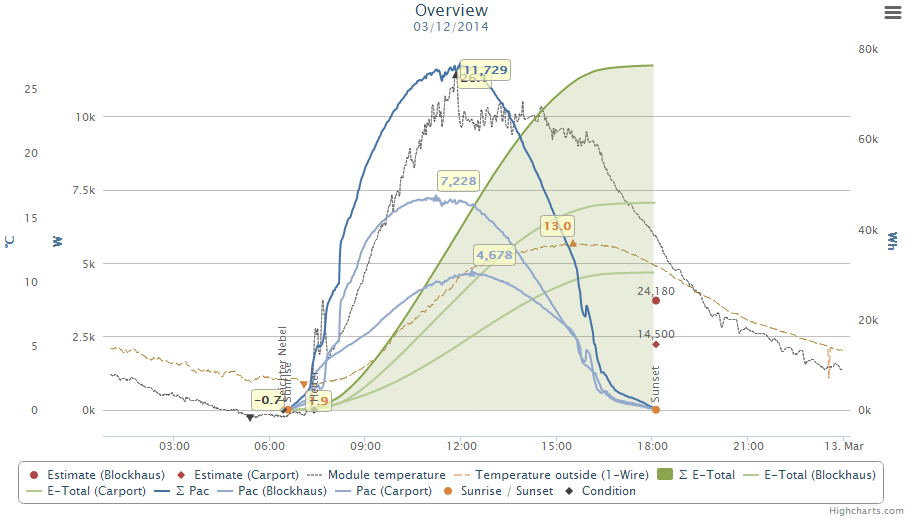
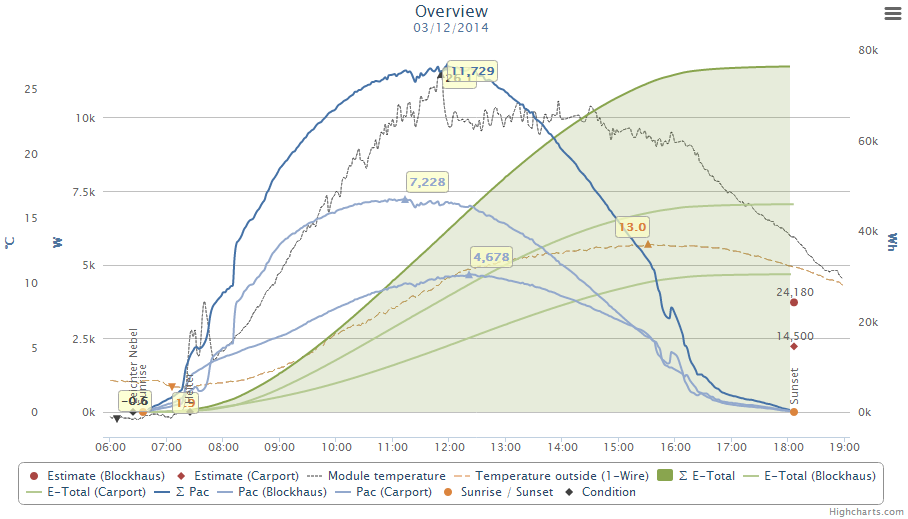
Limited time range example
From PhotoVoltaic Logger new generation
Sometimes it can be useful, to limit the chart display for a channel inside a day.
If you have a solar power plant, some relevant channels will have data only during daylight times.
If you show then other channels with 24hr data, you have always to zoom to get a closer view.
Here you see the production data and 2 temperature channels.
Now let's set the time ranges for the temperatures to 6 AM - 7 PM (24hr format).
After that the chart will look like this.
This will work only for consolidated data below "1 day", above it will be ignored.


