Energy import example
From PhotoVoltaic Logger new generation
Contents
Abstract
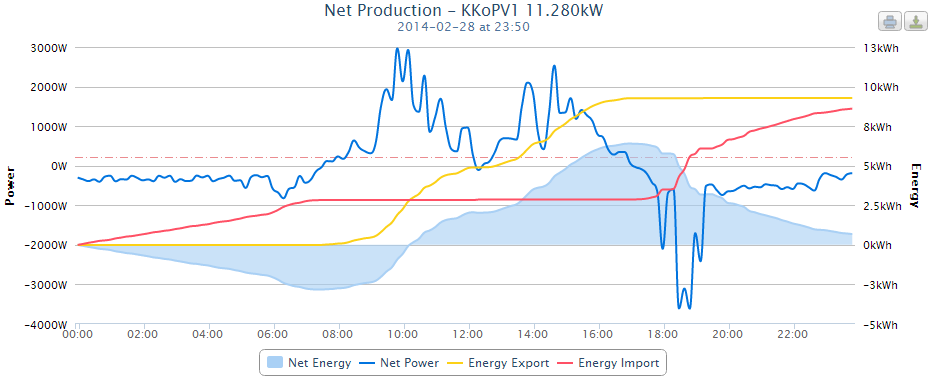
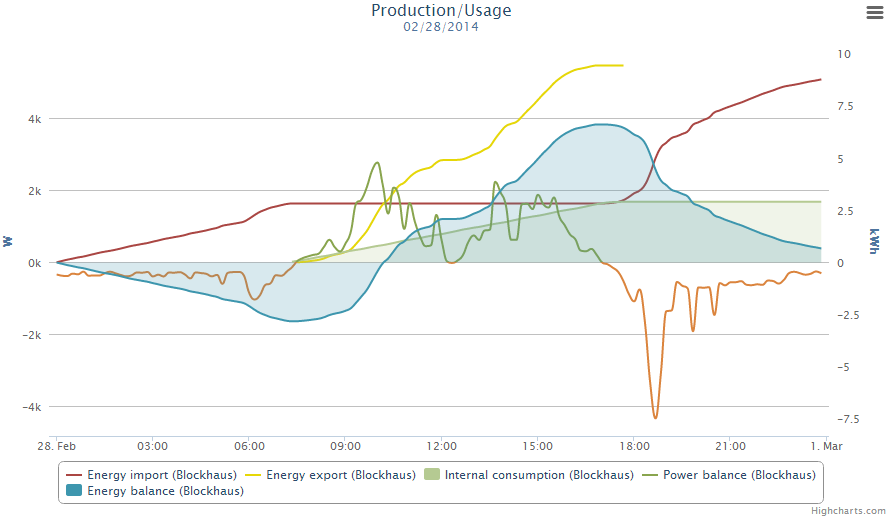
The so called "Energy import" is inspired by PVOutput energy import chart.
If the generated power (Net power) is greater than the consumption, the energy import is no more raising.
Charts
PVOutput
PVLng adoption
First there are 2 areas, the overall production (E-Total, blue) and overall consumption (Power consumption, red) over time.
Then the actual inverter yield (PAC Blockhaus, blue) and actual consumption (S0 consumption, dashed red).
The interesting part is the black Energy import spline, which stays by 2998 Wh since 07:08 here. This means, since 07:08 there is no energy import, only export.
Please note:
- Arrange the channels according their units to the axes!
Definition
Let's start with the meter channels for the areas.
I decided to put all "watt" channels on the left and all "watt hour" channels on the right axis.
E-Total
Definition
File:EnergyImportE-TotalChannel.png
We define here a positive cost per watt hour to see later the income amount generated.
(We get here 28.74 cent per kilo watt hour == 0.0002874 Euro per watt hour)
Chart settings
File:EnergyImportE-TotalChart.png
S0 consumption and Power consumption
Definition
Here we need also a special helper channel, the Sensor to Meter proxy.
We have to convert the actual power consumption (Power sensor in watt) into an meter channel (in watt hours) which also sums up the data.
Power consumption [Wh]
  |-> Power usage [W]
The Power usage is a normal power sensor and the Power consumption is the proxy to convert the sensor to a meter channel!
Chart settings
File:PowerConsumptionChartSettings.png File:PowerUsageChartSettings.png
For Power consumption we are also interested in peek powers used.
PAC
Definition
Simply the actual generated inverter power:
Chart settings
We are also interested in the max. value.
Energy Import
Definition
Here we need a channel based on the Import / Export channel type.
We define here a negative cost per Wh to see later the amount consumed.
(We pay here 23.44 cent per kilo watt hour == 0.0002344 Euro per watt hour)
Chart settings
File:EnergyImportChartSettings.png
Result
Now we can put this all together:
In the Charts view we will have this:


