Difference between revisions of "Design and concept"
From PhotoVoltaic Logger new generation
m (→External systems) |
|||
| Line 20: | Line 20: | ||
Scripts to push your data to other sides are also available, for photovoltaic plants I recommend [http://PV-Log.com PV-Log] or [http://pvoutput.org PVOutput]. | Scripts to push your data to other sides are also available, for photovoltaic plants I recommend [http://PV-Log.com PV-Log] or [http://pvoutput.org PVOutput]. | ||
| − | The [[web frontend]] handles all [[channel]] definitions, their attributes and the organization of channels in the [[channel | + | The [[:Category:Web frontend|web frontend]] handles all [[channel]] definitions, their attributes and the organization of channels in the [[Overview module|channel hirarchy]] and a [[Charts module]] for simple visualizations. |
=== PVLng === | === PVLng === | ||
Revision as of 08:55, 3 March 2014
Software layers
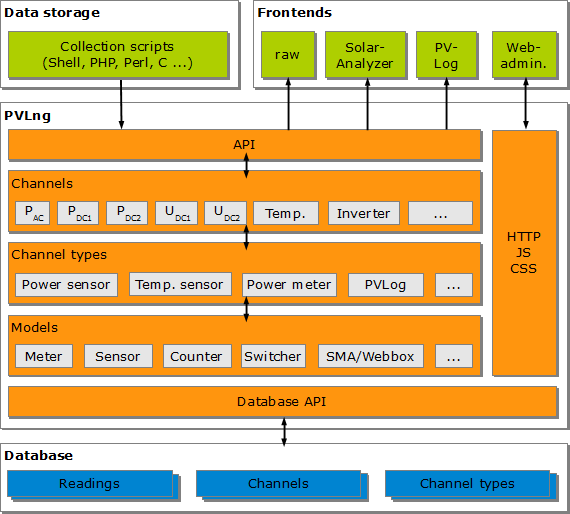
The whole system consists of 3 essential layers:
- External systems, which handles
- the data acquisition or
- the data analysis
- PVLng as core component
- A database for data storage (at the moment only MySQL via PHP mysqli module)
External systems
The most data storage work must be done by external scripts. They obtain the measuring data from e.g. sensors and push them via API into the system.
In these scripts are simple to use functions defined, which pushes the data and handles errors.
Scripts to push your data to other sides are also available, for photovoltaic plants I recommend PV-Log or PVOutput.
The web frontend handles all channel definitions, their attributes and the organization of channels in the channel hirarchy and a Charts module for simple visualizations.
PVLng
The system is build (bottom-up) by
- Models handles a very special kind of data/sensor
- Channel types implements a set set of predefined sensor types, each based on a model
- Channels represent concrete sensors, each based on a channel type
- Channel groups handles special needs about grouping or calculation/transformation
Database
The database have mainly 3 tables for channel organization, 2 tables for readings and some helper tables and views.
Data flow
The general information and data flow is like this:

