Difference between revisions of "Introduction"
From PhotoVoltaic Logger new generation
m (→Overview) |
m |
||
| Line 6: | Line 6: | ||
The system acts basely as a data warehouse. | The system acts basely as a data warehouse. | ||
| − | All data will be stored in an very simple and efficient internal structure ([[readings]]), optimized for data readout of any kind with a well defined interface. | + | All data will be stored in an very simple and efficient internal structure ([[Database structure|readings]]), optimized for data readout of any kind with a well defined interface. |
This system addresses all the user interested in data analysis, which will have a deeper look into their logged data. | This system addresses all the user interested in data analysis, which will have a deeper look into their logged data. | ||
Revision as of 08:53, 3 March 2014
Overview
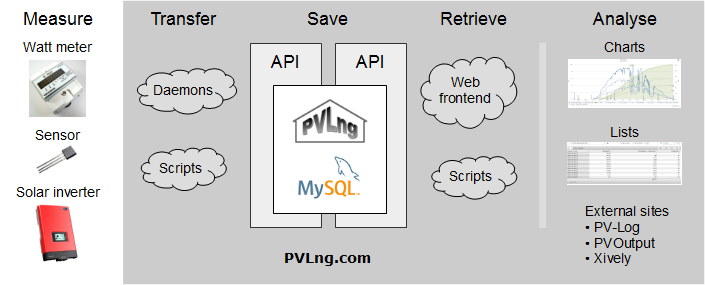
PVLng is a logging and data warehouse system for measuring data of sensors and photovoltaic plants.
The system acts basely as a data warehouse.
All data will be stored in an very simple and efficient internal structure (readings), optimized for data readout of any kind with a well defined interface.
This system addresses all the user interested in data analysis, which will have a deeper look into their logged data.
The system will accept data from any external sources and can deliver them for any purpose. A web frontend for graphing data is also integrated.
To use this system best, a deeper knowledge in server administration, shell scripting and probably PHP is recommended, but not required.
Refer to design and concept to understand the system organization regarding models, channel types, channels and groups.
Depending of the installed base of our solar plant, the following components are still implemented:
Data storage
- Inverter data (feed-in power, DC power voltage, Current etc.) from a SMA Webbox
- Irradiation and module temperature from a SMA Sensorbox
- Outside and inverter temperatures via USB -> 1‑Wire -> Temperature sensor
- Power consumption from watt meter via S0 impulses
Data readout
- Model for the PV-Log URL interface in JSON
- Script to push data to PVOutput
- Script to update a Twitter account
- [planned] Extractor witch creates Solar-Log compatible JS files, for example for Solar-Log homemade or SolarAnalyzer
Quick start
To get a 1st impression of the system, 2 fake channels are installed by default.
They deliver random data on each request.
To get a feeling with charts, you can use them to play around with the presentation settings.
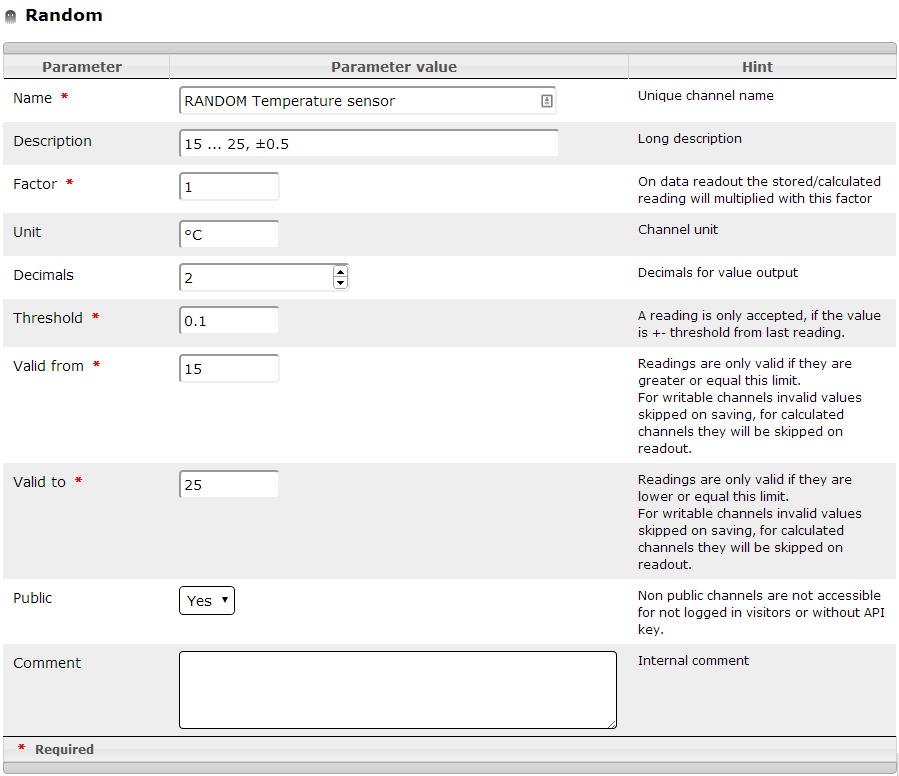
RANDOM Temperature sensor
This sensor simulates a temperature sensor in °C with a valid range of 15 ... 25 °C.
Each "next" reading differs max. ± 0.5 °C from last one.
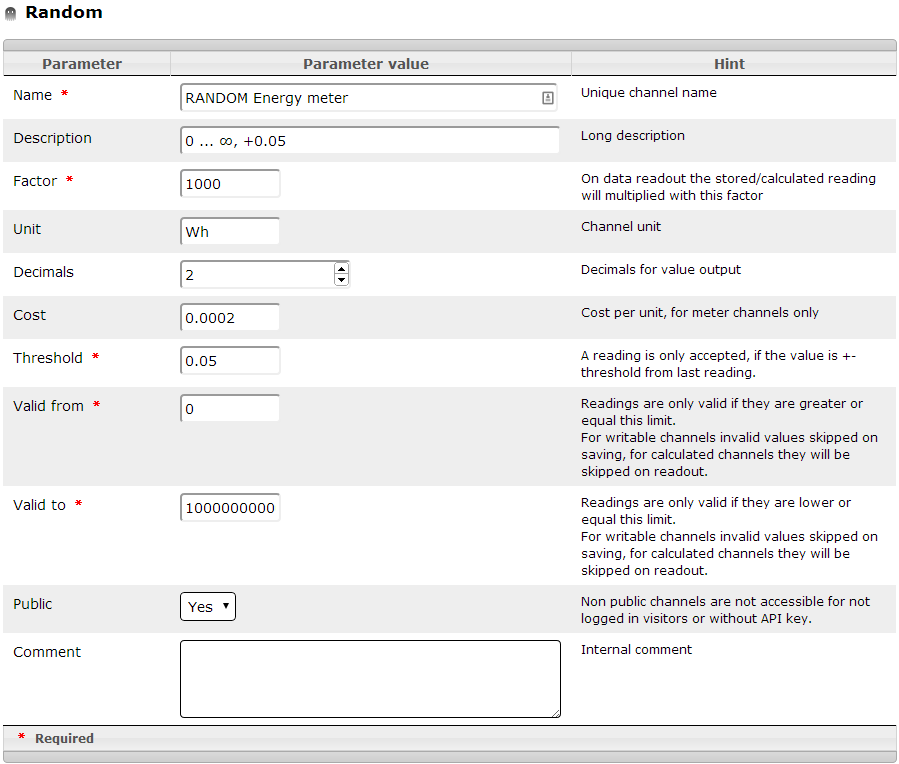
RANDOM Energy meter
This sensor simulates a energy meter with kilo watt hours readings, starting by 0 with (nearly :-) open end.
Each "next" reading differs max. + 0.2 kilo watt hour from last one.
The consumption cost 0.20 per kilo watt hour, because of the unit watt hours is it set to 0.0002
Please note: The readings here are in kilo watt hours, to get watt hours out, the resolution is set to 1000.


