Difference between revisions of "Top 10 analysis"
From PhotoVoltaic Logger new generation
m |
m (→Sensor channels) |
||
| (One intermediate revision by the same user not shown) | |||
| Line 20: | Line 20: | ||
== Sensor channels == | == Sensor channels == | ||
| − | === Find the days with the highest solar | + | === Find the days with the highest solar power === |
| − | The | + | The selections are the same as above, but now sort the '''Maximum descending'''. |
| − | |||
| − | |||
| − | [[File: | + | |
| + | [[File:Top10PowerMax.png]] | ||
| + | |||
| + | === Find the days with the highest average power === | ||
| + | |||
| + | Sort the '''Reading value''' column '''descending''', which stands for the average of the period. | ||
| + | |||
| + | |||
| + | [[File:Top10PowerAvg.png]] | ||
Latest revision as of 10:18, 3 June 2014
Top 10 analysis is possible with the List module.
Meter channels
Find the days with the most solar production
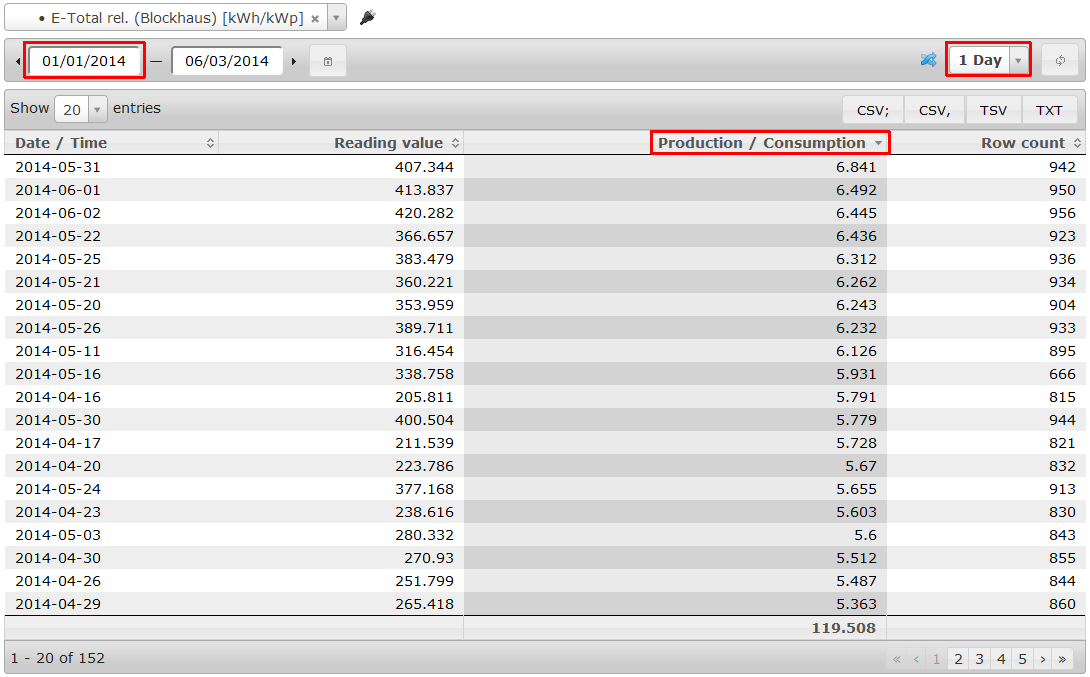
Go to your List module and make the following settings:
- Set the start date to 0 or empty the field to analyse all data or set to 1st of January for this year
- Set the consolidation period to 1 Day
- Select your channel and
- Sort the Production / Consumption column descending
Sensor channels
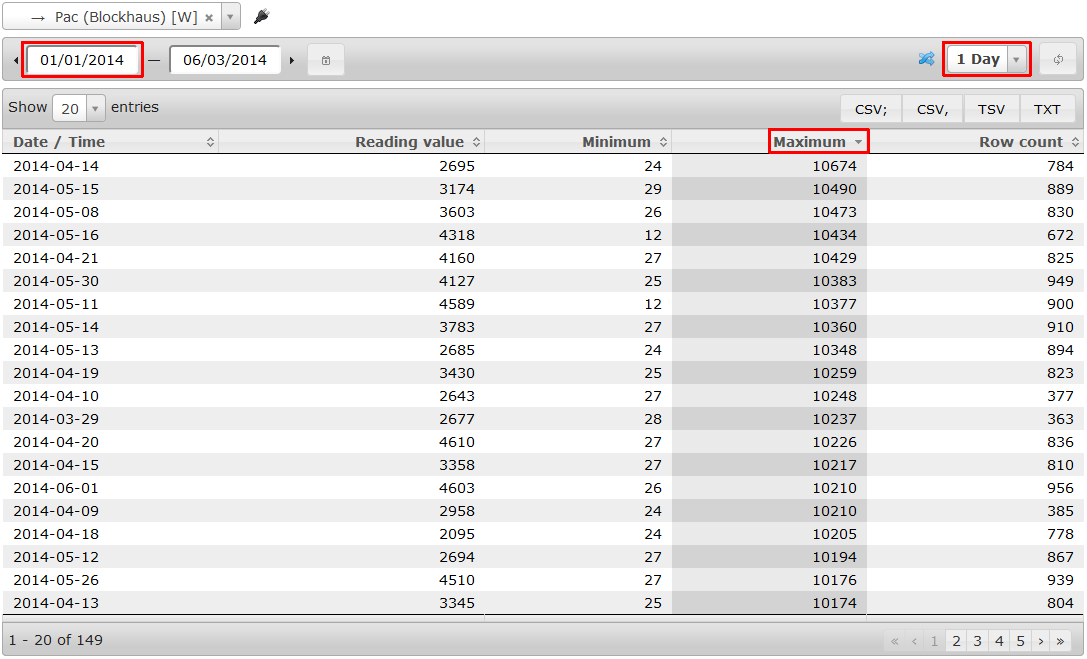
Find the days with the highest solar power
The selections are the same as above, but now sort the Maximum descending.
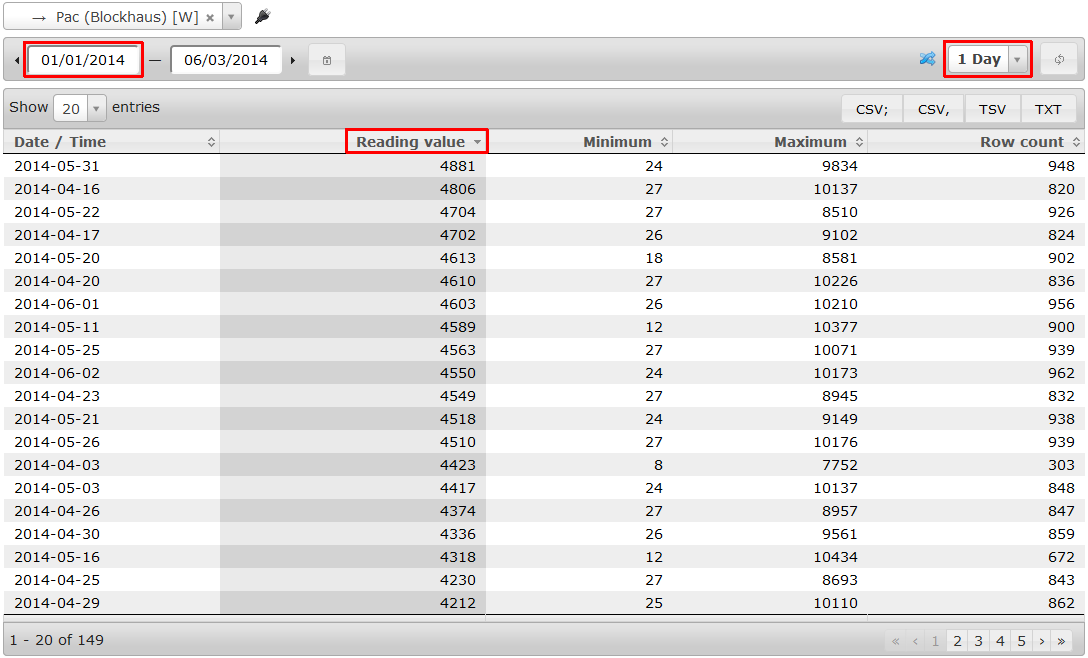
Find the days with the highest average power
Sort the Reading value column descending, which stands for the average of the period.


