Difference between revisions of "Limited time range example"
From PhotoVoltaic Logger new generation
m (KKoPV moved page Limited timerange example to Limited time range example without leaving a redirect) |
m |
||
| Line 26: | Line 26: | ||
[[File:ChartWithTimeRange2days.png]] | [[File:ChartWithTimeRange2days.png]] | ||
| + | [[Category:Charts]] | ||
[[Category:Example]] | [[Category:Example]] | ||
Latest revision as of 23:21, 22 March 2014
Sometimes it can be useful, to limit the chart display for a channel inside a day.
If you have a solar power plant, some relevant channels will have data only during daylight times.
If you show then other channels with 24hr data, you have always to zoom to get a closer view.
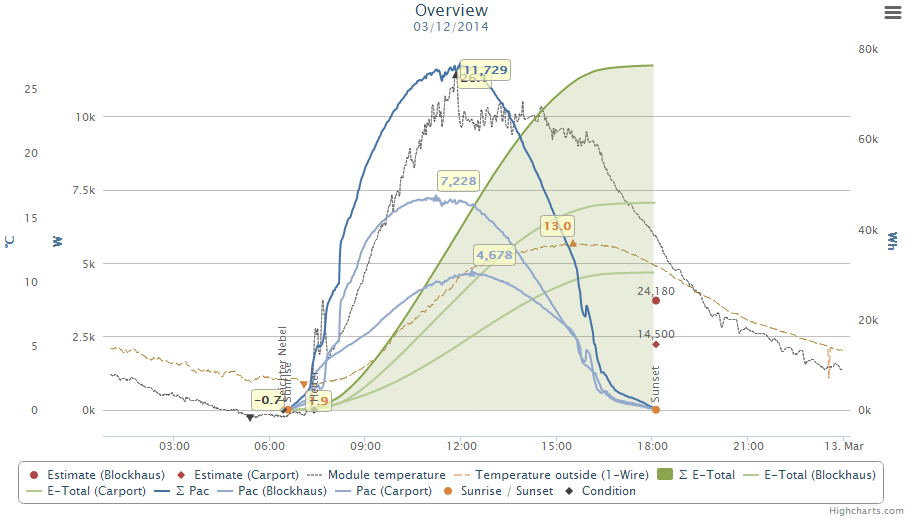
Here you see the production data and 2 temperature channels.
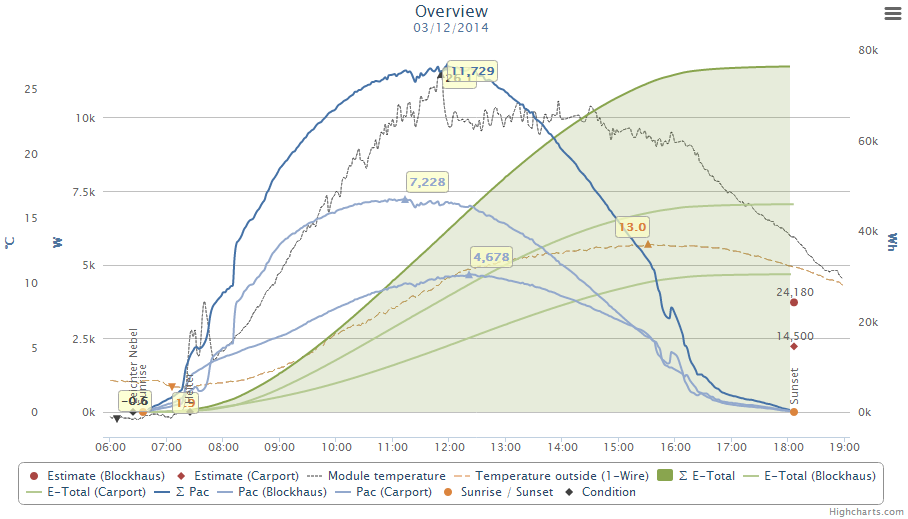
Now let's set the time ranges for the temperatures to 6 AM - 7 PM (24hr format).
After that the chart will look like this.
Please note:
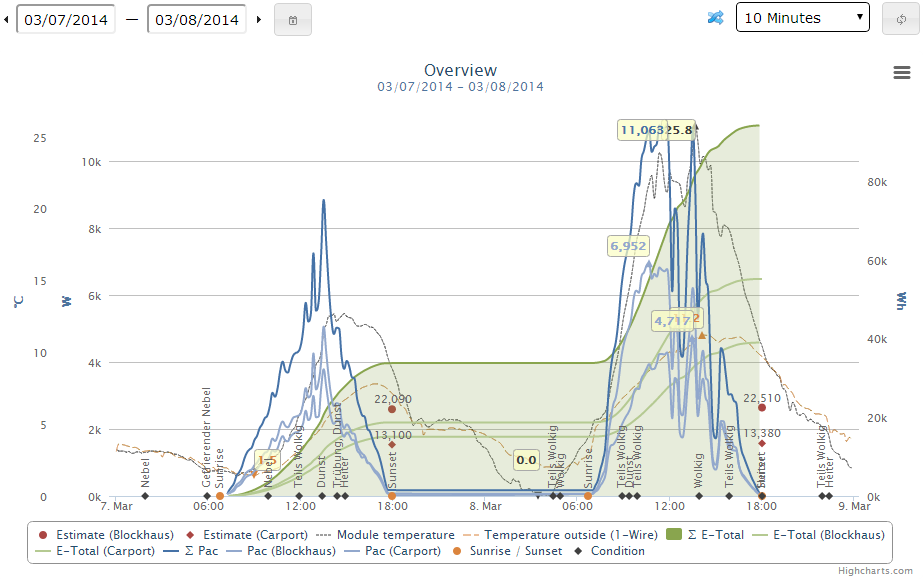
- This will work only, if you show data inside 1 day, otherwise all data will be shown!


