Infoframe module
From PhotoVoltaic Logger new generation
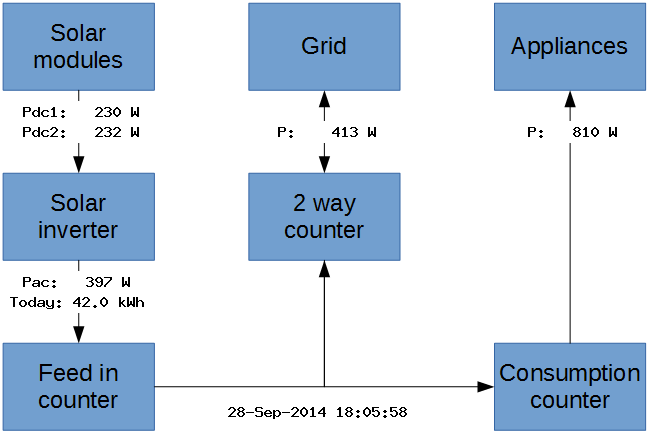
You can also visualize your data on an info/photo frames, which only supports images.
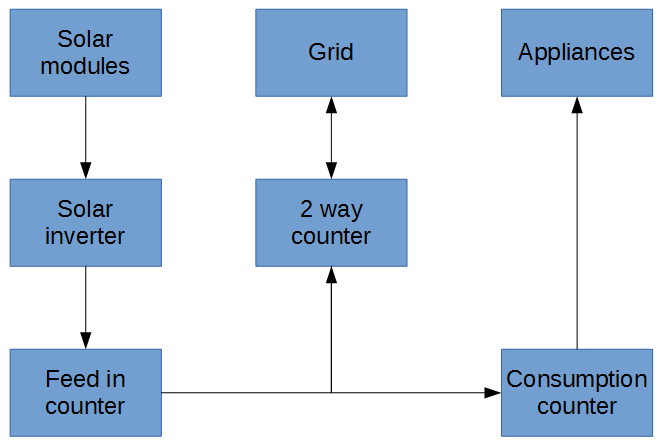
It uses an image as base and a configuration script for what and where to show data.
Setup
Background image
Configuration
Configure where the graphic should show what. At the moment, all texts become a white background (not configurable yet).
For my graphic I use the following configuration:
   return array(

       array(
           'guid'    => 'a0f3-065d-1b14-4dd5-18ab-69a1-a69f-8227',
           'font'    => 5,
           'label'   => 'Pdc1: %5.0f W',
           'x'       => 30,
           'y'       => 110
       ),
       array(
           'guid'    => '297c-00a2-9c1d-b054-c4e8-164c-3531-c88c',
           'font'    => 5,
           'label'   => 'Pdc2: %5.0f W',
           'x'       => 30,
           'y'       => 130
       ),

       array(
           'guid'    => 'fc0d-af98-021d-dac2-ab12-cf7b-9284-b925',
           'font'    => 5,
           'label'   => 'Pac: %5.0f W',
           'x'       => 30,
           'y'       => 280
       ),
       array(
           'guid'    => '956a-01b4-6be0-e89b-1110-8658-9b90-472e',
           'start'   => 'midnight',
           'font'    => 5,
           'label'   => 'Today: %4.1f kWh',
           'x'       => 17,
           'y'       => 300,
       ),

       array(
           'guid'    => '5b7a-00b2-c572-79b4-6706-40aa-a58e-0547',
           'font'    => 5,
           'label'   => 'P: %6.0f W',
           'x'       => 285,
           'y'       => 130
       ),

       array(
           'guid'    => 'bf87-5e5e-7dfd-ffc4-32d9-58fd-a5ea-4242',
           'font'    => 5,
           'label'   => 'P: %5.0f W',
           'x'       => 535,
           'y'       => 130
       ),

       array(
           'font'    => 5,
           'label'   => '{DATETIME}',
           'x'       => 235,
           'y'       => 410
       ),
   );

