Difference between revisions of "Dashboard module"
From PhotoVoltaic Logger new generation
m (→Channel definition) |
m (→Multiple Dashboards) |
||
| (44 intermediate revisions by the same user not shown) | |||
| Line 1: | Line 1: | ||
| − | [[File: | + | {{TOCright}} |
| + | == Access == | ||
| + | |||
| + | If you have defined dashboards, you can acess them by hover the "Dashboard" menu item. | ||
| + | |||
| + | [[File:DashboardHover.png]] | ||
== Preparation == | == Preparation == | ||
| − | Define your dashboard using Dashboard channels | + | Define your dashboard using '''Dashboard''' channels, you can select then only these channels!! |
| + | |||
| + | <div style="float:left;text-align:center"> | ||
| + | '''<big>Channel hierarchy</big>''' | ||
| + | ----------------------- | ||
| + | |||
[[File:DashboardTree.png]] | [[File:DashboardTree.png]] | ||
| + | </div> | ||
| + | |||
| + | <div style="float:left;margin:0 5em"> | ||
| + | '''<big>vs.</big>''' | ||
| + | </div> | ||
| + | |||
| + | <div style="float:left;text-align:center"> | ||
| + | '''<big>Dashboards channels selection</big>''' | ||
| + | ----------------------------------- | ||
| + | |||
| + | |||
| + | [[File:DashboardChannels.png]] | ||
| + | </div> | ||
<div style="clear:both"></div> | <div style="clear:both"></div> | ||
| − | + | The specialized '''dashboard channels''' have some additional features: | |
| + | * Definition of axis <tt>start</tt> and <tt>end</tt> values | ||
| + | * Definable <tt>color bands</tt> on the axis | ||
| − | |||
| − | |||
| − | |||
| + | [[File:DashboardChannel.png]] | ||
| + | |||
| + | These channels inherits also the icon of its child channel. | ||
== Channel definition == | == Channel definition == | ||
| Line 21: | Line 46: | ||
start > end : color | start > end : color | ||
| + | * Spaces around delimiters are optional | ||
* For <tt>start</tt> and <tt>end</tt> absolute or relative (with % suffix) values allowed, also mixed | * For <tt>start</tt> and <tt>end</tt> absolute or relative (with % suffix) values allowed, also mixed | ||
* If <tt>start</tt> is not given, begins from axis starts | * If <tt>start</tt> is not given, begins from axis starts | ||
| Line 26: | Line 52: | ||
* Colors can be defined as HTML color names (<tt>green</tt>, <tt>red</tt> etc.) or HTML color codes (<tt>#123456</tt>) | * Colors can be defined as HTML color names (<tt>green</tt>, <tt>red</tt> etc.) or HTML color codes (<tt>#123456</tt>) | ||
| − | E.g. for a temperature channel (with axis range -30°C ... 30°C) the following are equivalent | + | E.g. for a temperature channel (with axis range -30°C ... 30°C) the following are equivalent: |
| − | > 0 : blue == -30 > 50% | + | > 0 : blue == -30 > 50% : #0000FF |
| − | + | 0 > 20 : green == 50% > 20 : #008000 | |
| − | 20 > : red == | + | 20 > : red == 20 > 100% : #FF0000 |
| − | + | === Example === | |
[[File:InverterTemperatureDashboard.png|left]] | [[File:InverterTemperatureDashboard.png|left]] | ||
<div style="margin-left:240px"> | <div style="margin-left:240px"> | ||
| − | + | Axis range: -15 °C ... 55 °C | |
| − | > 0 : # | + | > 0 : #BBF // below zero |
0 > 35 : #BFB // ok 0 ... 35°C | 0 > 35 : #BFB // ok 0 ... 35°C | ||
35 > 40 : #FFB // warning 35°C ... 40°C | 35 > 40 : #FFB // warning 35°C ... 40°C | ||
| Line 46: | Line 72: | ||
<div style="clear:both"></div> | <div style="clear:both"></div> | ||
| + | |||
| + | == Multiple Dashboards == | ||
| + | |||
| + | You can have an unlimited number of dashboards. | ||
| + | * '''Mark''' the relevant channels | ||
| + | * '''Sort''' their order by dragging them around | ||
| + | * Give it a '''name''' and | ||
| + | ** '''Create''' a '''new''' dashboard or | ||
| + | ** '''Change''' the '''loaded''' dashboard or | ||
| + | * '''Delete''' the '''loaded''' dashboard | ||
| + | |||
| + | |||
| + | [[File:DashboardDefine.png|800px]] | ||
| + | |||
| + | === Examples === | ||
| + | |||
| + | <gallery> | ||
| + | File:Dashboard3.png|3 Channels | ||
| + | File:Dashboard4.png|4 Channels | ||
| + | File:Dashboard6.png|6 Channels | ||
| + | File:Dashboard8.png|8 Channels | ||
| + | </gallery> | ||
== Advanced usage == | == Advanced usage == | ||
| − | You can embed the dashboard also anywhere else, for example via iframe. | + | You can embed the dashboard also anywhere else, for example via <tt><nowiki><iframe ... ></nowiki></tt>. |
| − | For this view, no authorization is required! | + | '''Please note:''' For this view, '''no authorization''' is required! |
To get the embedded view, just use | To get the embedded view, just use | ||
| − | <nowiki>http://your.domain.here/dashboard/embed</nowiki> | + | <nowiki>http://your.domain.here/dashboard/embed/<dashboard slug></nowiki> |
| + | |||
| + | You can find this link on this bookmark button: [[File:DashboardEmbedLink.png]] | ||
| − | You can this also use to run PVLng on an info frame, just open | + | You can this also use to run PVLng on an info frame, just open the embedded mode in full screen! |
[[Category:Web frontend]] | [[Category:Web frontend]] | ||
Latest revision as of 21:53, 8 June 2014
Access
If you have defined dashboards, you can acess them by hover the "Dashboard" menu item.

Preparation
Define your dashboard using Dashboard channels, you can select then only these channels!!
Channel hierarchy

vs.
Dashboards channels selection

The specialized dashboard channels have some additional features:
- Definition of axis start and end values
- Definable color bands on the axis

These channels inherits also the icon of its child channel.
Channel definition
Define to color bands for the gauges like this.
start > end : color
- Spaces around delimiters are optional
- For start and end absolute or relative (with % suffix) values allowed, also mixed
- If start is not given, begins from axis starts
- If end is not given, ends on axis end
- Colors can be defined as HTML color names (green, red etc.) or HTML color codes (#123456)
E.g. for a temperature channel (with axis range -30°C ... 30°C) the following are equivalent:
   >  0 : blue         ==       -30  >  50% : #0000FF
 0 > 20 : green        ==        50% >  20  : #008000
20 >    : red          ==        20  > 100% : #FF0000
Example

Axis range: -15 °C ... 55 °C
   >  0 : #BBF  // below zero
 0 > 35 : #BFB  // ok 0 ... 35°C
35 > 40 : #FFB  // warning 35°C ... 40°C
40 >    : #FBB  // critical above 40°C
Multiple Dashboards
You can have an unlimited number of dashboards.
- Mark the relevant channels
- Sort their order by dragging them around
- Give it a name and
- Create a new dashboard or
- Change the loaded dashboard or
- Delete the loaded dashboard

Examples
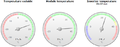
3 Channels
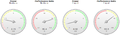
4 Channels
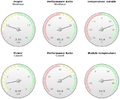
6 Channels
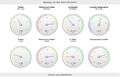
8 Channels


Advanced usage
You can embed the dashboard also anywhere else, for example via <iframe ... >.
Please note: For this view, no authorization is required!
To get the embedded view, just use
http://your.domain.here/dashboard/embed/<dashboard slug>
You can find this link on this bookmark button: ![]()
You can this also use to run PVLng on an info frame, just open the embedded mode in full screen!